Investment and economic outlook, August 2024
Region-by-region economic outlook and latest forecasts for investment returns.

.
This month, we take a closer look at interest rates and the changed anatomy of bond returns. They’re simple enough dynamics: Interest rates rise, bond prices fall; interest rates fall, bond prices rise. But what happens when you factor in the income that bonds generate? The conditions at the start of an investment matter. And as the charts suggest, initial conditions were far more favourable to bond investors at midyear 2024 than they were at midyear 2021, underscoring Vanguard’s assertion that bonds are back!
An expected boost from bond coupons
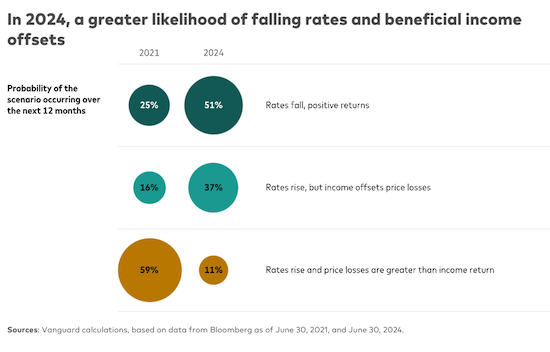
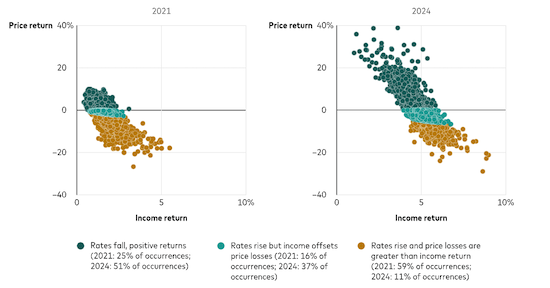
Notes: The charts show the 1-year-ahead price and income return projections from the Vanguard Capital Markets Model® for the Bloomberg U.S. Aggregate Bond Index as of June 30, 2021, and June 30, 2024. The forecasts are sorted by positive price returns (interest rates fall) and two scenarios under negative price returns (interest rates rise): income returns from coupons offset price losses, and income returns do not offset price losses, leading to negative total returns.
Sources: Vanguard calculations, based on data from Bloomberg as of June 30, 2021, and June 30, 2024.
Bond yields at midyear 2021 were a paltry 0.25% for the 2-year and 1.45% for the 10-year, compared with midyear 2024 yields of 4.71% for the 2-year and 4.36% for the 10-year. Although it is always difficult to predict short-term outcomes, our simulations as of June 30 of each year showed that the likelihood was much higher in 2024 than in 2021 that interest rates would fall (and bond prices rise). In addition, the likelihood that rates would rise (and bond prices fall) but that income would offset price losses more than doubled in 2024. And as for the prospect of the worst of both worlds—that rates would rise and price losses would be greater than returns from income? It was the most likely outcome in 2021. But in 2024, that scenario was less than 20% as likely to occur as in 2021, our Vanguard Capital Markets Model® (VCMM) projections show.
In 2024, a greater likelihood of falling rates and beneficial income offsets
“Bonds are back, but the prospect of falling rates isn’t the only reason—yield income is higher, too,” said Ian Kresnak, an investment strategy analyst on the VCMM team. “It's the return to sound money, the broad scenario that we laid out in the Vanguard economic and market outlook for 2024. Bonds always play an essential role in a portfolio because they balance out more volatile equities. With coupon payments higher, as they are now, bonds can also withstand some price declines if rates were to rise.”
IMPORTANT: The projections or other information generated by the Vanguard Capital Markets Model regarding the likelihood of various investment outcomes are hypothetical in nature, do not reflect actual investment results, and are not guarantees of future results. Distribution of return outcomes from the VCMM are derived from 10,000 simulations for each modeled asset class. Simulations are as of June 30, 2021, and June 30, 2024. Results from the model may vary with each use and over time. For more information, please see the Notes section.
Vanguard’s outlook for financial markets
We have updated our forecasts for the performance of major asset classes, based on the June 30, 2024, running of the Vanguard Capital Markets Model®. Detailed projections, including annualised return and volatility estimates covering both 10- and 30-year horizons, are available in interactive charts and tables.
Region-by-region outlook
The views below are those of the global economics and markets team of Vanguard Investment Strategy Group as of August 16, 2024.
Australia
Emphasising that it will be “some time yet before inflation is sustainably in the target range,” the Reserve Bank of Australia (RBA) on 6 August left its policy rate unchanged at 4.35%. Vanguard expects the RBA to remain on hold for the rest of the year before beginning a gradual easing cycle amid an anticipated weakening in both inflation and the labour market.
- Headline inflation rose to 3.8% in the second quarter on an annual basis from 3.6% in the first quarter, its first increase since the quarter ended December 2022. Given low productivity growth and, as a result, higher unit labour costs, we don’t foresee headline or core inflation falling to the midpoint of the RBA’s 2%–3% target range until 2025.
- The economy created more than 58,000 jobs on a seasonally adjusted basis in July, far stronger than expected for a second straight month. The unemployment rate ticked higher, to 4.2% from 4.1% in June, a second straight month of an increase of that magnitude, as the participation rate increased solidly, to a record 67.1%. We expect the unemployment rate to rise to around 4.6% by the end of 2024 as financial conditions tighten in an environment of elevated interest rates.
- Demand has weakened in response to the RBA’s restrictive monetary policy, but the economy’s supply side has also been constrained, with lacklustre productivity growth keeping inflationary pressures elevated. GDP rose 1.1% year over year on a seasonally adjusted basis in the first quarter, but was down 1.3% on a per-capita basis for that period.
United States
Recent data suggest that the labour market is softening, and the Federal Reserve appears to be taking notice. The Fed gave a strong signal in July that it was prepared to cut the federal funds rate target by 25 basis points in September. (A basis point is one-hundredth of a percentage point.) We are anticipating an additional second 25-basis-point cut this year and a target range of 3.25%–3.5% at the end of 2025.
- The U.S. economy created 114,000 jobs in July, and the unemployment rate rose to 4.3%. The unemployment rate increase is attributable to labour force growth exceeding job growth rather than an increase in job losses.
- Broad consumer prices rose in July at the slowest year-over-year pace since early 2021. The Consumer Price Index (CPI) rose by 2.9% compared with July 2023, with shelter price increases accounted for nearly 90% of the monthly increase. The report reaffirms our view that shelter inflation will remain sticky through the rest of the year as supply expands only slowly and demand remains steady.
- The Fed’s preferred inflation measure to guide policymaking, the core Personal Consumption Expenditures (PCE) price index, held steady year-over-year in June, rising by 2.6%. We foresee the pace of core PCE rising to 2.9% by year-end because of challenging comparisons with year-earlier data.
- The U.S. economy displayed continued resilience in the second quarter, with real GDP growth increasing by an annualised 2.8%, with support from increases in consumer spending, nonresidential fixed investment, and government spending. Through midyear, GDP growth is tracking largely in line with our 2% outlook for the year.
Canada
Softening growth in the labour market and the broader economy amid continued disinflation has led us to lower our year-end 2024 forecast for Canada’s policy interest rate, which the Bank of Canada cut for a second time to 4.5% on July 24. We foresee the equivalent of two to three additional quarter-point rate cuts this year, which would put the overnight rate target in a range of 3.75%-4% at year-end.
- The Consumer Price Index report provided further evidence of easing inflation. Headline inflation came in at 2.7% in June on a year-over-year basis, down from a 2.9% rise in May. Core inflation, which excludes volatile food and energy prices, was 2.9% in June on a year-over-year basis, the same level as in May. We foresee core inflation ending 2024 in a range of 2.1%–2.4%.
- Household spending helped GDP grow by 0.4% in the first quarter compared with a flat fourth quarter in 2023. We expect below-trend growth for the full year in a range of 1.25%–1.5% amid monetary policy restrictiveness that has been more potent than in the U.S.
- The labour market is stagnating, recent data suggest. Canada’s economy shed 2,800 jobs in July, a second straight month of modest job losses, and the unemployment rate held steady at 6.4%. Risks have increased that the unemployment rate could go above our year-end forecast range of 6%–6.5%, as still-restrictive monetary policy could eat into demand and, ultimately, corporate profitability.
Euro area
The euro area’s economy grew by 0.3% in the second quarter compared with the first, according to a flash estimate. An unexpected drag from Germany, where a manufacturing sector rebound remains elusive, was offset by tourism bolstering growth in Spain and France. We foresee full-year GDP growth around 0.8%.
- The year-over-year pace of headline inflation increased to 2.6% in July compared with 2.5% in June as there was a reacceleration in services inflation. Core inflation, which excludes volatile food, energy, alcohol, and tobacco prices, remained at 2.9% year over year for a third straight month. We foresee headline inflation falling to around 2.2% by year-end and core inflation falling to around 2.6%, reaching the European Central Bank’s (ECB) target in 2025.
- The ECB left its deposit facility rate unchanged at 3.75% in July after a quarter-point rate cut in June. However, we expect further cuts that will put the policy rate at 3.25% at year-end 2024 and 2.25% at year-end 2025.
- The unemployment rate rose to 6.5% on a seasonally adjusted basis in June from a record low of 6.4% in May. Although we foresee the unemployment rate ending 2024 around current levels, lower corporate profit margins skew risks to the upside.
United Kingdom
The most recent growth and inflation data suggest the U.K. economy is moving into a better balance. Inflation was softer than expected in July and second-quarter growth was only minimally less than that of the first quarter, when the U.K. exited a brief recession.
- The Bank of England (BOE) lowered its policy rate on August 1 by 25 basis points to 5%, the first cut in the current cycle. We foresee one more policy rate cut this year, with the policy rate ending 2024 at 4.75%, and quarterly 25-basis-point cuts in 2025.
- GDP increased by 0.6% in the second quarter compared with the first, modestly below 0.7% first-quarter growth. We foresee the economy growing by 1.2% for all of 2024.
- The pace of headline inflation increased in July, rising to 2.2% year over year from 2.0% year over year in June, largely owing to energy prices having fallen by less than they did a year earlier.
- Core inflation, which excludes volatile food, energy, alcohol, and tobacco prices, slowed to 3.3% year over year in July, from 3.5% in June. We expect core inflation to end 2024 around 2.8% year over year and to hit the BOE’s 2% target by the second half of 2025.
- The unemployment rate unexpectedly fell to 4.2% in the April–June period, from 4.4% in the March–May period. We foresee the unemployment rate ending 2024 in a range of 4%–4.5%, but risks skew to the upside given recent signs of labour market softening.
China
Recent broad economic data pointed to a tepid start to the third quarter and a continued imbalance in supply and demand. Fixed asset investment surprised notably to the downside and manufacturing investment slowed. Retail sales provided a bright spot amid increased summer travel and online sales.
- GDP grew by 4.7% year over year in the second quarter, reflecting weak domestic demand, sluggish imports, and subdued inflation. We continue to foresee China growing by 5.1% for the full year, though supply and demand that remain out of balance could challenge that growth’s sustainability.
- The pace of inflation as measured by consumer prices rose by 0.5% year over year in July, above expectations but well below the PBOC’s 3% inflation target. We expect reflation in 2024 to be mild, with headline inflation of 0.8% and core inflation of just 1.0%.
- We expect further monetary policy easing following a surprise rate cut by the People’s Bank of China. The PBOC lowered its new policy benchmark, the seven-day reverse repo rate, from 1.8% to 1.7% on July 22, the first such reduction in the rate since August 2023.
- We also expect measures to rescue the housing market, including further relaxation of purchase requirements and cuts to mortgage rates to stimulate demand.
Emerging markets
Progress in the inflation fight is increasingly allowing central banks to focus on economic growth and labour market vitality in their policy-setting considerations. But risks remain that progress in the inflation fight can stall.
- Magyar Nemzeti Bank, Hungary’s central bank, cut its policy rate by 25 basis points on July 23, to 6.75%—a 10th consecutive reduction—only to learn that inflation had spiked to a seven-month high in July.
- Banco Central do Brasil held its policy Selic rate at 10.5% for a second straight meeting on July 31. It likely found little comfort when headline inflation came in at 4.5% year over year in July, a third straight month of acceleration, and 0.38% month over month.
- Banco Central de Chile held its policy rate steady on July 31 at 5.75%. The bank estimated that, if its economic assumptions hold up, the bulk of its 2024 cuts—which currently total 2.5 percentage points—will have already taken place.
- Banco de México (Banxico) cut its target for the overnight interbank rate for the second time this year, by 25 basis points, to 10.75%, effective August 9. Vanguard anticipates an additional 50 to 100 basis points of cuts in 2024, to a year-end range of 9.75%–10.25%, levels that would still be restrictive.
- Mexico’s GDP growth slowed to 1.1% year over year in the second quarter, down from 1.9% in the first quarter. We expect full-year growth in a range of 1.75%–2.25%, but will be watching for signs of restrictive policy rates weighing on consumption and fixed asset investment.
Notes:
All investing is subject to risk, including the possible loss of the money you invest.
Investments in bonds are subject to interest rate, credit, and inflation risk.
Investments in stocks and bonds issued by non-U.S. companies are subject to risks including country/regional risk and currency risk. These risks are especially high in emerging markets.
IMPORTANT: The projections and other information generated by the Vanguard Capital Markets Model regarding the likelihood of various investment outcomes are hypothetical in nature, do not reflect actual investment results, and are not guarantees of future results. VCMM results will vary with each use and over time.
The VCMM projections are based on a statistical analysis of historical data. Future returns may behave differently from the historical patterns captured in the VCMM. More important, the VCMM may be underestimating extreme negative scenarios unobserved in the historical period on which the model estimation is based.
The Vanguard Capital Markets Model® is a proprietary financial simulation tool developed and maintained by Vanguard’s primary investment research and advice teams. The model forecasts distributions of future returns for a wide array of broad asset classes. Those asset classes include U.S. and international equity markets, several maturities of the U.S. Treasury and corporate fixed income markets, international fixed income markets, U.S. money markets, commodities, and certain alternative investment strategies. The theoretical and empirical foundation for the Vanguard Capital Markets Model is that the returns of various asset classes reflect the compensation investors require for bearing different types of systematic risk (beta). At the core of the model are estimates of the dynamic statistical relationship between risk factors and asset returns, obtained from statistical analysis based on available monthly financial and economic data from as early as 1960. Using a system of estimated equations, the model then applies a Monte Carlo simulation method to project the estimated interrelationships among risk factors and asset classes as well as uncertainty and randomness over time. The model generates a large set of simulated outcomes for each asset class over several time horizons. Forecasts are obtained by computing measures of central tendency in these simulations. Results produced by the tool will vary with each use and over time.
This article contains certain 'forward looking' statements. Forward looking statements, opinions and estimates provided in this article are based on assumptions and contingencies which are subject to change without notice, as are statements about market and industry trends, which are based on interpretations of current market conditions. Forward-looking statements including projections, indications or guidance on future earnings or financial position and estimates are provided as a general guide only and should not be relied upon as an indication or guarantee of future performance. There can be no assurance that actual outcomes will not differ materially from these statements. To the full extent permitted by law, Vanguard Investments Australia Ltd (ABN 72 072 881 086 AFSL 227263) and its directors, officers, employees, advisers, agents and intermediaries disclaim any obligation or undertaking to release any updates or revisions to the information to reflect any change in expectations or assumptions.
© 2024 Vanguard Investments Australia Ltd. All rights reserved.
Vanguard
August 2024
vanguard.com.au
Latest eNewsletters
Hot Issues
- Four SMSF breaches high on the ATO’s radar
- Home is where the super is for many Australians
- Investment and economic outlook, February 2025
- TBC increase not just about pensions
- SAR non-lodgment continues to be a concern: ATO
- Increase in prohibited loans a concern: ATO
- Retiree confidence undermined
- The Most Held Currencies in the World | 1850-2024
- Up to 700k retirees could be paying more tax than they should: SMC
- Calls for clarification on NALI/E rulings
- Australia’s economic growth set to recover in 2025
- Carer rights - interdependency relationships
- Division 296 deliberately deceptive
- Five financial steps for the new year
- How to shift into pension mode
- Best Selling BOOKS of all Time
- Preparing your kids for financial success
- Investment and economic outlook
- It’s super hump month. Make the most of it
- Know the difference between general and specific NALE
- Super funds finish 2024 with double-digit returns
- 9 Ways You Can Invest Using SMSF
- End-of-year break time for super check-up
- Most Powerful Economies in Europe | 1960-2024
- Women still outpacing men in SMSF establishments
- Economic and market outlook for 2025: Global summary
- Preparing to lodge quarterly January TBAR
- How to overcome your investment fears
- Navigating the outcome of the U.S. election
- Divorce doesn’t alter contribution rules